
Index
- Introduction to Money Market and Money Market Graph.
- Demand and Supply of Money in the Money Market Graph.
- Impact of Nominal Interest Rates on the Price of Bonds.
- Conclusion
Introduction to Money Market and the Money Market Graph

To understand Money Market Graph, let us first understand what is Money Market. Money Market is an exchange market wherein the participants will have the choice to lend or borrow short term debts and loans having an average maturity of at least a year. Many institutions and even the government and banks participate in the Money Market. This increases the cash flow and income in the Money Market.
Now, a Money Market Graph is a graph that represents the relationship between the money supplied and the rate of interest.
The ways in investing in Money Market include an individual buying a treasury bill or opening a Money Market account in a bank. There are a few important terms you need to know in the Money Market Graph.
A Money Market Graph has a supply curve, a demand curve, equilibrium price, and an equilibrium quantity. In the Money Market Graph, axis labels are present. The y-axis of the graph represents the Nominal Interest Rate. The Nominal Interest Rate means that the component in the y-axis is not just adjusted for inflation of the stocks but also the change in the price.
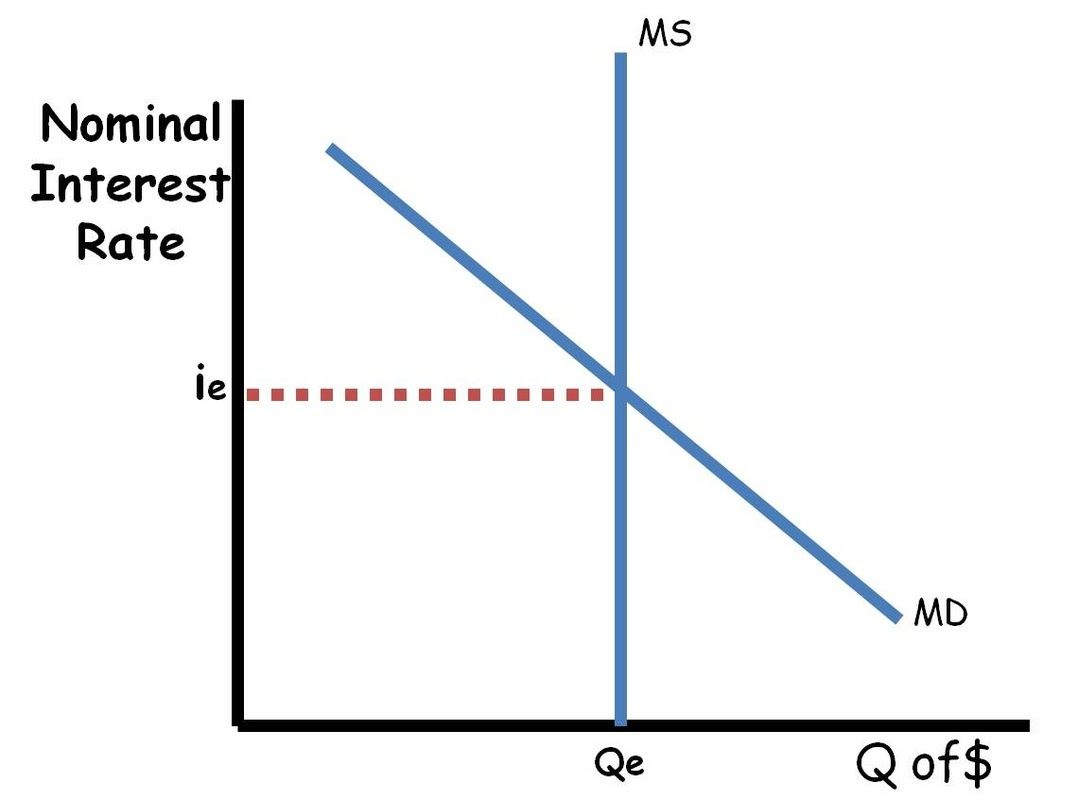
The x-axis represents the quantity of money. In the below graph, the demand curve is the decreasing downward slope and the supply curve is vertical which means it’s inelastic.
Demand and Supply of Money in the Money Market Graph
There are two things which make up the demand curve in the graph. They are the transaction demand for money and Assets demand money. In the first case, transaction demand money is defined as the total amount of money required to make the transactions smoother throughout the entire economy. The transaction demands money and the nominal GDP rates are directly proportional to each other.
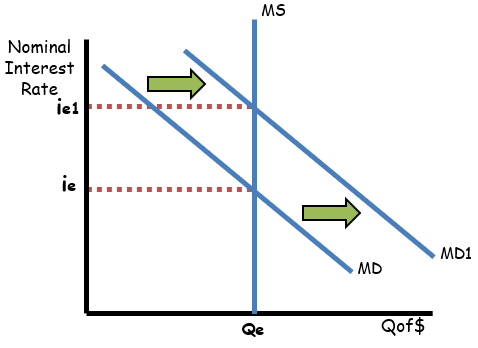
In the second case, we all know that money is the most liquid asset. But just holding the money won’t get you any profit as you can’t build up interest. But, by keeping or storing the assets in the form of CD, money market or even in a savings account where the interest rate is high can save your money and increase the profit. If the asset has a lower rate of interest, the money in hand would be more and if the asset has a higher rate of interest, then the money in hand would be less. This inverse relationship in the asset and nominal interest rate causes a downward slope of the demand curve. The graphical representation of the demand curve is given below.
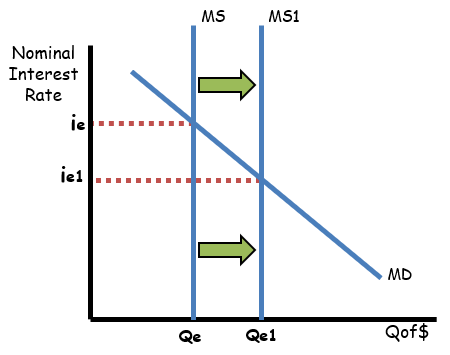
The supply or the money supply is completely independent of the interest rate and hence, we can say that it is perfectly inelastic. The Federal Reserve controls the inflow of the money supply. The Federal Reserve (1) uses the Monetary Policy to change the supply rates and this has an impact on the Equilibrium Nominal Interest Rate. Usually, the banks are also charged a certain amount of interest rate, known as Discount rate, when they borrow money from the feds. The bank won’t loan out a certain amount of checkable deposits known as Reserve requirement. Increasing the reserve requirement of the bank will decrease the inflow of money and decreasing the reserve requirement will result in the increase of the cash flow to the bank by the consumers.
Open Market Operations is the process of buying and selling the bonds or securities from or to the Federal Reserves. So, we can say that buying securities or bonds increases the monetary profits and selling bonds decreases the monetary profits. The actions taken by the Federal Reserve will have a huge impact on the nominal interest rate. This will change the gross investment rate and hence, this will have an effect on the Money Market Graph, instilling changes in the economy. This resembles a cycle where the change in one element disrupts the entire cycle. The actions of the Federal Reserve are closely tied with the balance sheets of every bank. The graph given below shows the supply rate.
Impact of Nominal Interest Rates on the Price of Bonds
The nominal interest rates represented in the Money Market Graph and even the interest rates of loans given out by the banks have an impact on the price of bonds. The increase of the interest rates results in a decrease of the bond prices and vice versa. By this observation, we can say that they are inversely proportional. For example, if a bond is bought for $2000, it gives an interest rate of 5 percent. If over the years, the interest rate drops to 2.5 percent, the bond price would shoot up to $4000. This is the influence of nominal interest rates on the price of bonds.
Conclusion
The Money Market plays a very important role in international trades. It provides huge funds to the government through the profit acquired in interests. Not only the government, but it also provides funds for private institutions and even to the public who have a Money Market account. Through the Money Market Graph, the interest rates and supply rates can be calculated. This will increase the liquidity and security of financial assets.


